|
(2009-12)
The CO2 Bubble...This KML attempts to give a sense of scale to our CO2 emissions. It illustrates the total volume of CO2 emitted by man since the Industrial Revolution, as well as emission growth through the last two centuries. The KML also shows, next to the Eiffel Tower, an enormous pyramid of coal corresponding to the total amount burned by mankind throughout history.Data Sources: Please see the full script used in the KML below, with references.
Thanks to 3dHH for the low-polygon Eiffel Tower model from the Google Sketchup 3D Warehouse used in this KML.
 Open Google Earth file
|
|
||||
About the calculationsThe CO2 spheres, coal pyramids and big atmosphere sphere in this KML are shown at the correct size (sea level pressure is used for the gas spheres). The calculations can be found below.Emissions in this KML are mentioned either in tons of carbon, tons of carbon dioxide (CO2), or tons of coal equivalent. They compare as follows: 1 ton of carbon = 3.67 tons of CO2 (44/12) = 1.74 tons of coal (44/12 / 2.107). ( http://www.epa.gov/RDEE/energy-resources/refs.html ) Pyramids: To estimate the size of a pyramid of coal equivalent to our total historic emissions: 530,000,000,000 tons of carbon * 44g CO2 / 12g C / 2.107 g CO2 / g coal = 922,322,417,339 tons of coal. ... / 0.833 ton/m3 (density of bituminous coal) / 109 m3/km3 = 1,107 square kilometers of coal. ( http://www.simetric.co.uk/si_materials.htm ) ... which makes a pyramid with a height 2/3 of it's side (the ratio of the Khafre pyramid of Giza) the size: (3 * 1107 * 3/2)(1/3) = 17.1 kilometer side and 17.1*2/3 = 11.4 kilometer high. (this includes emissions from all sources, not just coal - a pyramid of all the coal we have burned would be 7.6 km high) CO2 Spheres: Creating a sphere of CO2 the size of our 2008 emissions: 8,700,000,000 tons of carbon * 44g CO2/12g C / 1.977 kg/m3 (density of CO2 at 1 atm) = 16,136 square kilometers. ... which makes a sphere (3/4 / π * 4400)(1/3) * 2 = 31.4 kilometers across. |
|||||
This is our atmosphere, all 5148 trillion tons of it, as if curled up
http://en.wikipedia.org/wiki/Earth_atmosphere
|
|||||
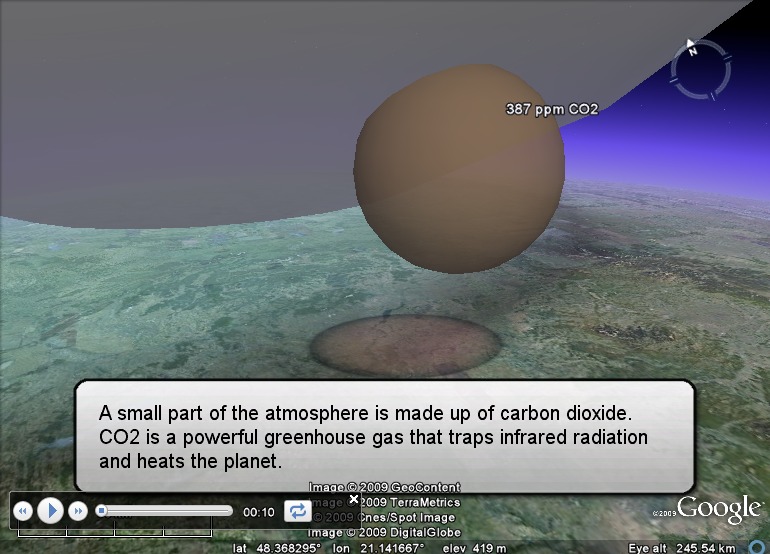
A small part of the atmosphere is made up of carbon dioxide.
CO2 acting as a greenhouse gas has been known since 1859. |
|||||
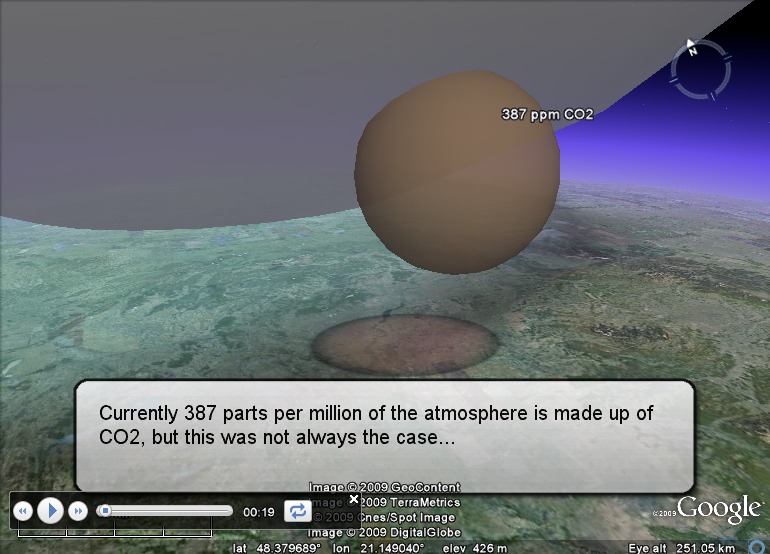
Currently 387 parts per million of the atmosphere is made up of
http://www.esrl.noaa.gov/gmd/ccgg/trends/
|
|||||
Since the Industrial Revolution we have been burning coal and
|
|||||
In the beginning we were burning about 5.2 million tons of coal
http://cdiac.ornl.gov/trends/emis/tre_glob.html
|
|||||
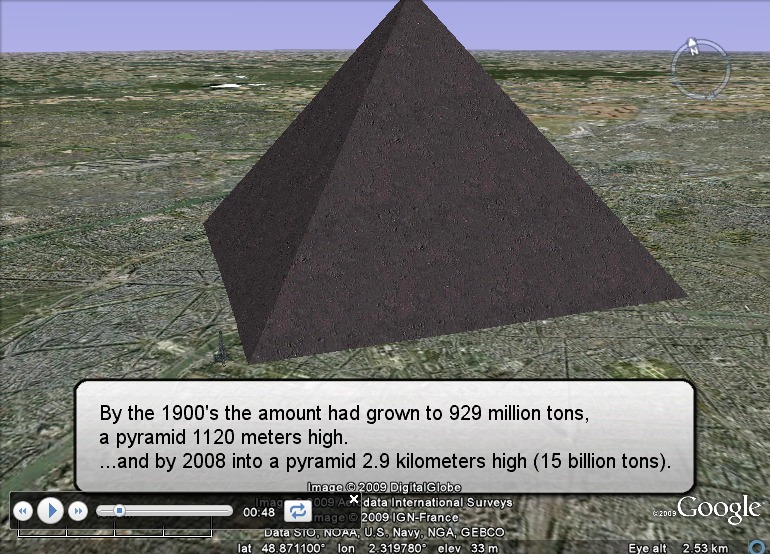
By the 1900's the amount had grown to 929 million tons,
http://cdiac.ornl.gov/trends/emis/tre_glob.html
|
|||||
...and by 2008 into a pyramid 2.9 kilometers high (15 billion tons).http://cdiac.ornl.gov/trends/emis/tre_glob.html |
|||||
In reality coal makes up roughly one third of our historic emissions,
http://cdiac.ornl.gov/trends/emis/tre_glob.html |
|||||
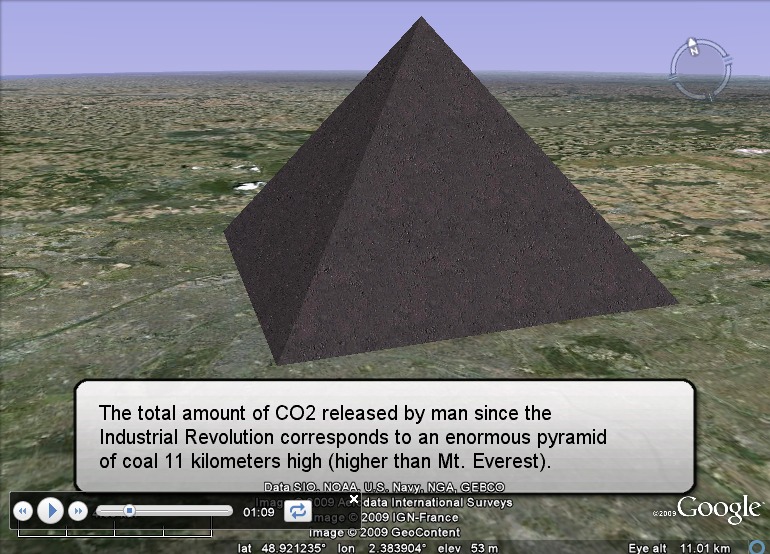
The total amount of CO2 released by man since the
http://www.trillionthtonne.org/
|
|||||
Half a trillion tons of fossil carbon, carved out of the ground
http://www.trillionthtonne.org/
|
|||||
If we ever release the next 500 billion tons,
http://www.trillionthtonne.org/
|
|||||
Back again to the beginning of the Industrial Revolution... |
|||||
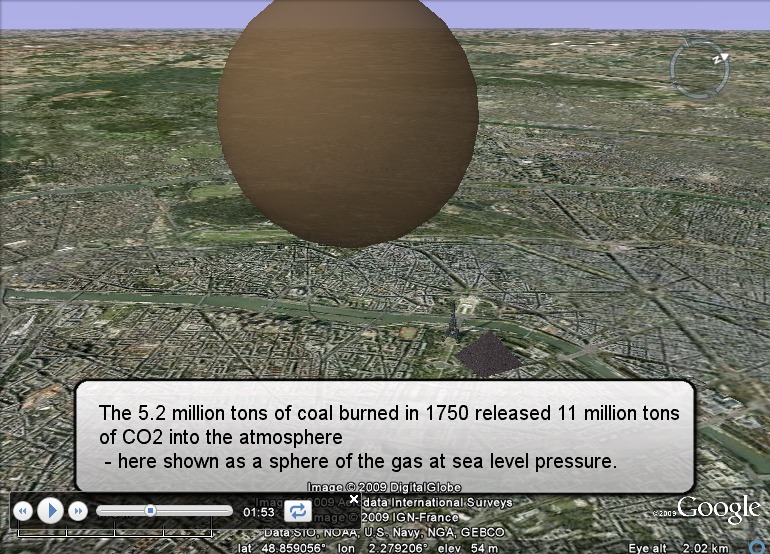
The 5.2 million tons of coal burned in 1750 released 11 million tons
http://cdiac.ornl.gov/trends/emis/tre_glob.html |
|||||
Emissions rose slowly at first, reaching 29 million tons of CO2
http://cdiac.ornl.gov/trends/emis/tre_glob.html
|
|||||
In 1824 the greenhouse effect of certain gases in the atmosphere
(Joseph Fourier) |
|||||
In 1859 CO2 was first recognized as a greenhouse gas - the
(John Tyndall) |
|||||
In 1896 the first estimates for Global Warming due to the buildup
(Svante Arrhenius) |
|||||
Today we know that roughly half of the manmade CO2 emissions
http://en.cop15.dk/news/view+news?newsid=2961
|
|||||
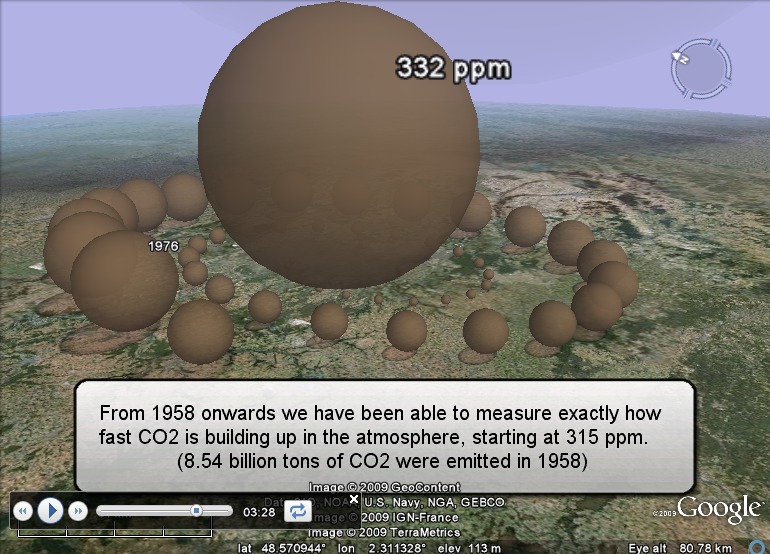
From 1958 onwards we have been able to measure exactly how
Atmospheric CO2 was at roughly 315 ppm when measurements began.
|
|||||
In 1988 the Intergovernmental Panel on Climate Change (IPCC)
http://en.wikipedia.org/wiki/Intergovernmental_Panel_on_Climate_Change |
|||||
In 1997 the Kyoto Protocol is established, and industrialized
http://en.wikipedia.org/wiki/Kyoto_protocol |
|||||
In 2008 we emitted 32 billion tons of CO2, and levels in the
http://news.mongabay.com/2009/1117-hance_carbonemissions.html
|
|||||
Our emissions are rising higher every year, and also rising
http://www.esrl.noaa.gov/gmd/ccgg/trends/
|
|||||
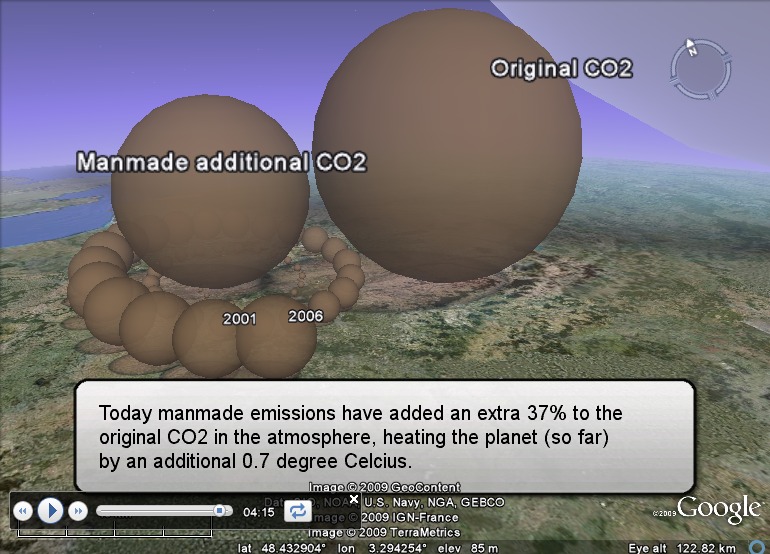
Today manmade emissions have added an extra 37% to the
http://www.nasa.gov/worldbook/global_warming_worldbook.html
|
|||||
Arctic summer sea ice has melted faster than predicted by any
http://nsidc.org/arcticseaicenews/
|
|||||
It is probably already too late to avoid an ice-free arctic in the
http://en.cop15.dk/news/view+news?newsid=2985
|
|||||
